This post is also available in: 日本語
Introduction

This article explains how to use the Google Data Portal to categorize data into arbitrary groups. Press the link below to read more about Google’s data portal.
Google Data Portal Makes Data Visualization Easy and Attractive!
In the Google Data Portal, you can create arbitrary data groups by taking advantage of calculated fields.
For example, you can:.
- Want English and non-English users
- Want to connect social media users
- I want to group pages for a specific URL?
- I want to consolidate certain areas
What are calculated fields?
Calculated fields are a feature of the Google Data Portal that allows you to create your own metrics or dimensions by arbitrarily processing and calculating the fields in your data source.
Using Calculated Fields
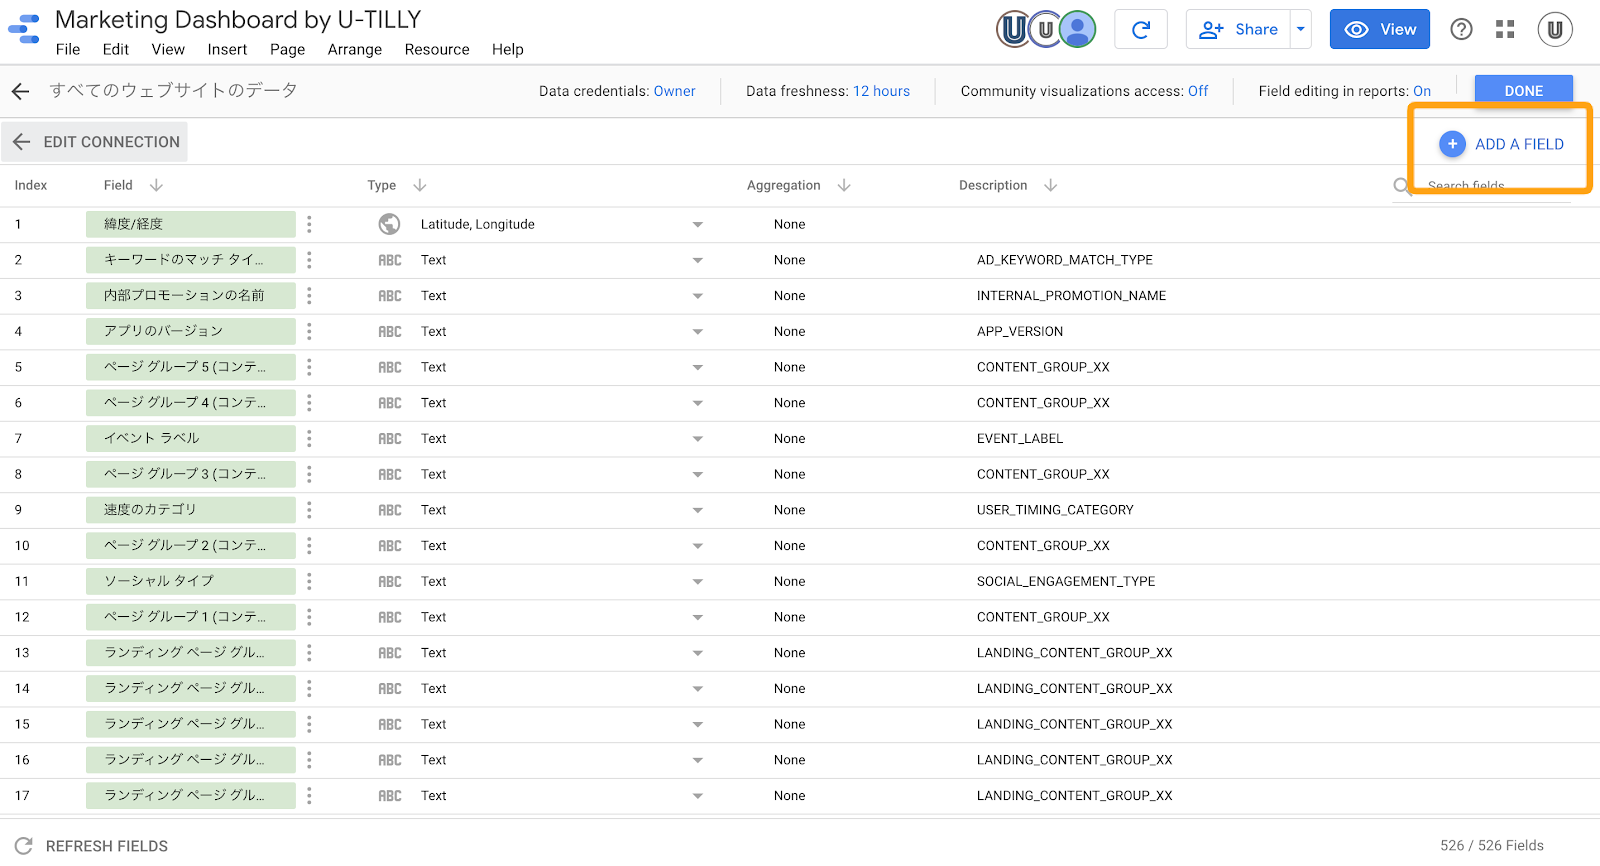
Select Resources > Manage Added Data Sources > “Edit” for any data source.
Click Add Field in the upper right corner.
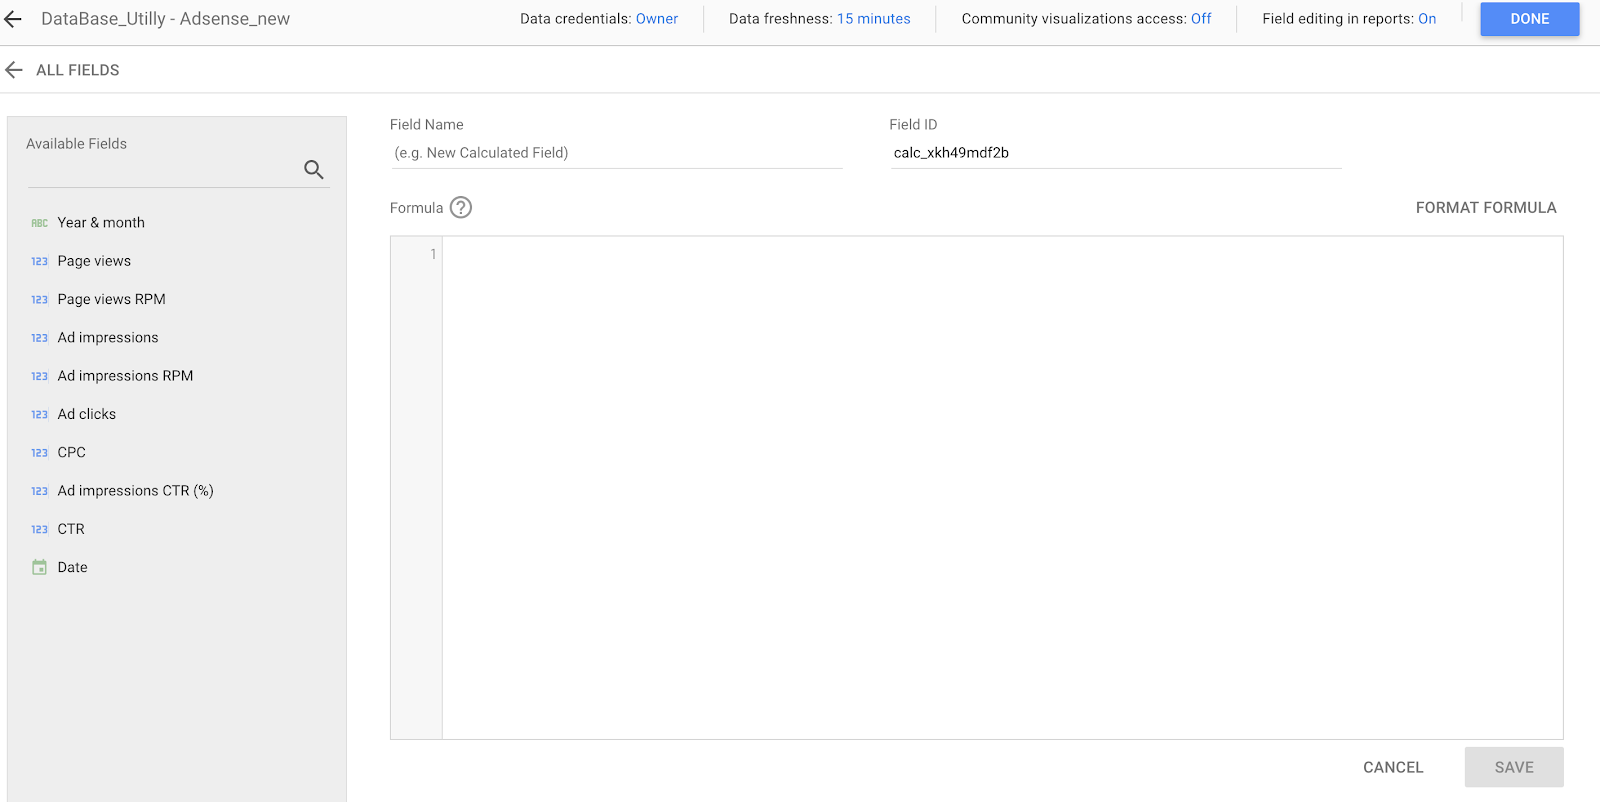
The formula editing screen is a calculated field as shown below.
What is a CASE statement?
This function is often used in CASE statements to group existing data or define new data.
For example, to group the values for a given country into a [Sales Region] dimension, create a CASE statement similar to the following:.
WHEN Country IN (“USA”,”Canada”,”Mexico”)THEN “North America”
WHEN Country IN (“England”,”France”)THEN “Europe”
ELSE “Other”
END
In the example above, you can see that the area covers the selected countries.
You can use it to:.
For example, consider a situation where you have data sourced from Google Analytics and you want to “Want to separate users in Japan from users in other countries”. The basic idea is to group users outside of Japan, for example, from other countries such as the US or China.
The basic syntax of the CASE statement is as follows:.
WHEN condition THEN result
ELSE Results
END
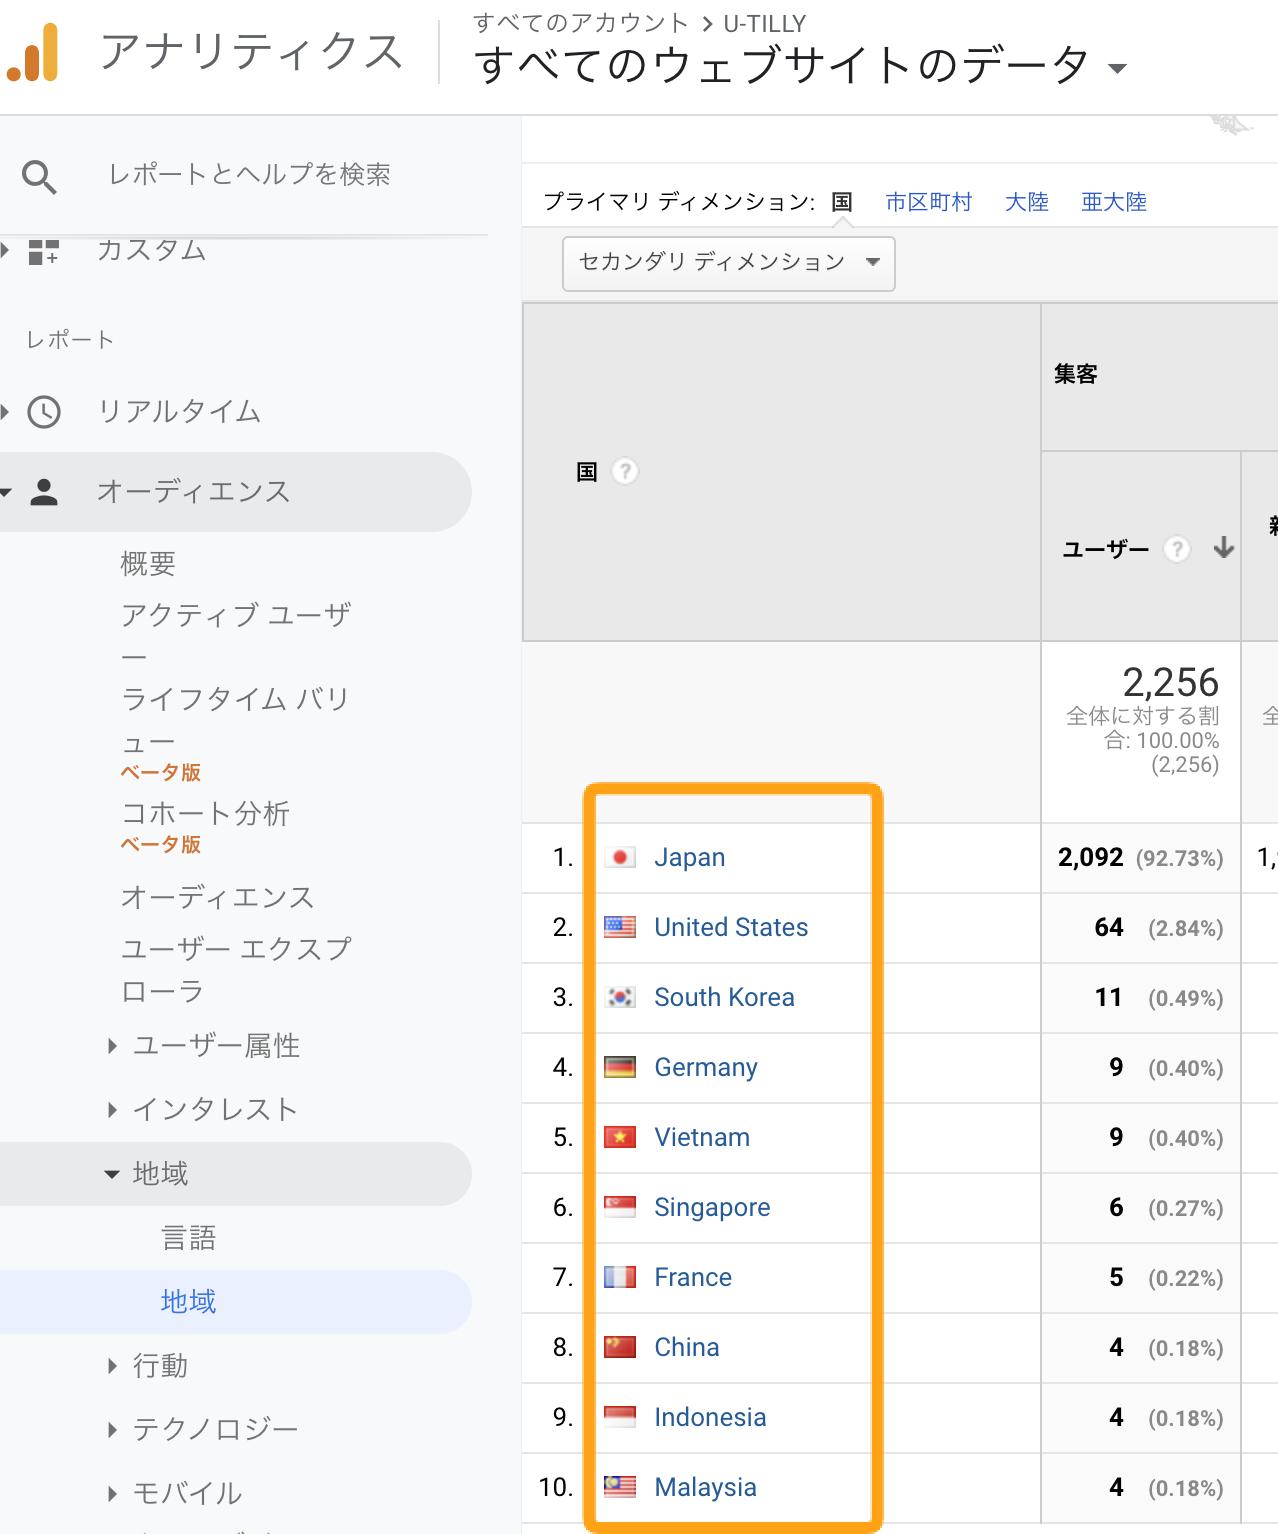
It starts with CASE and ends with END. This result is shown under this condition. Otherwise, this result is shown. That’s the way of thinking. The dimension that selects countries in Google Analytics is Country. Also, the country is written in English such as Japan and China. You can actually see this in Google Analytics.
The specific syntax is:.
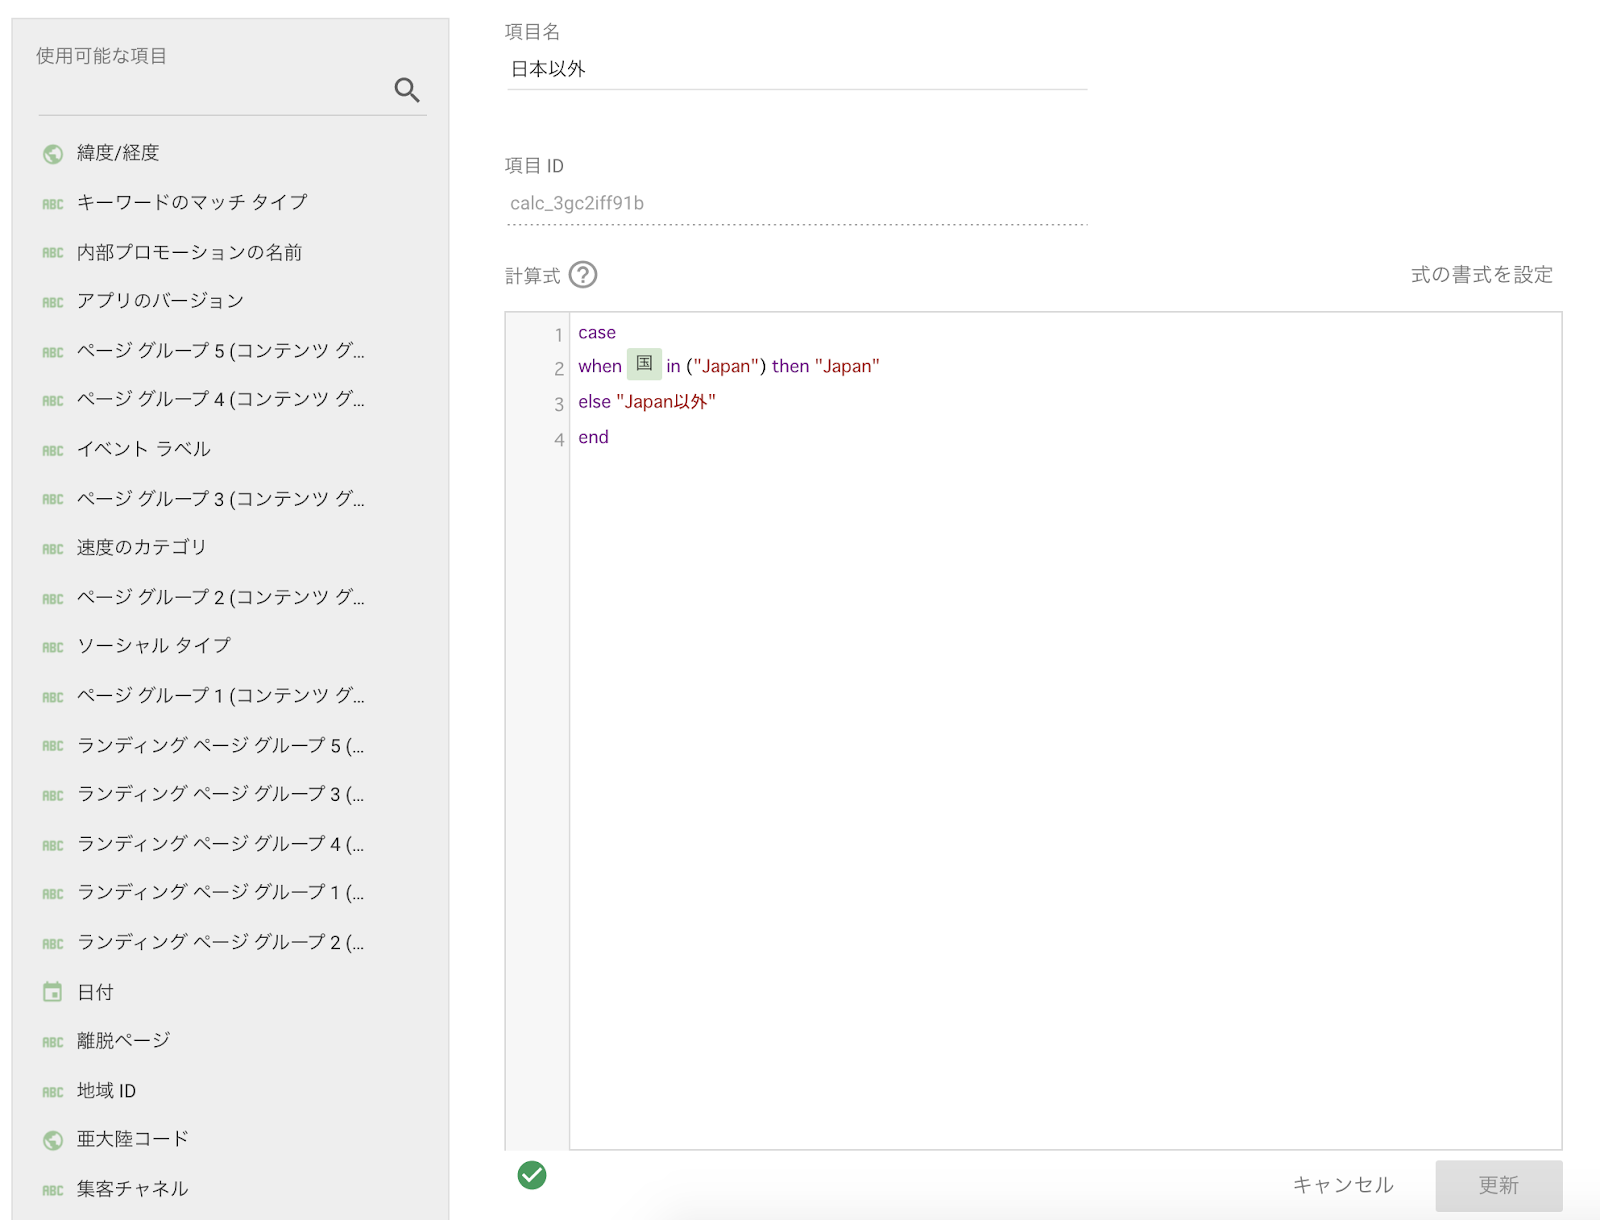
When the country is Japan, it is defined as “Japan”. Otherwise, it is defined as “Outside Japan”.
It means.
when country in (“Japan”) then “Japan”
else “Outside Japan”
end
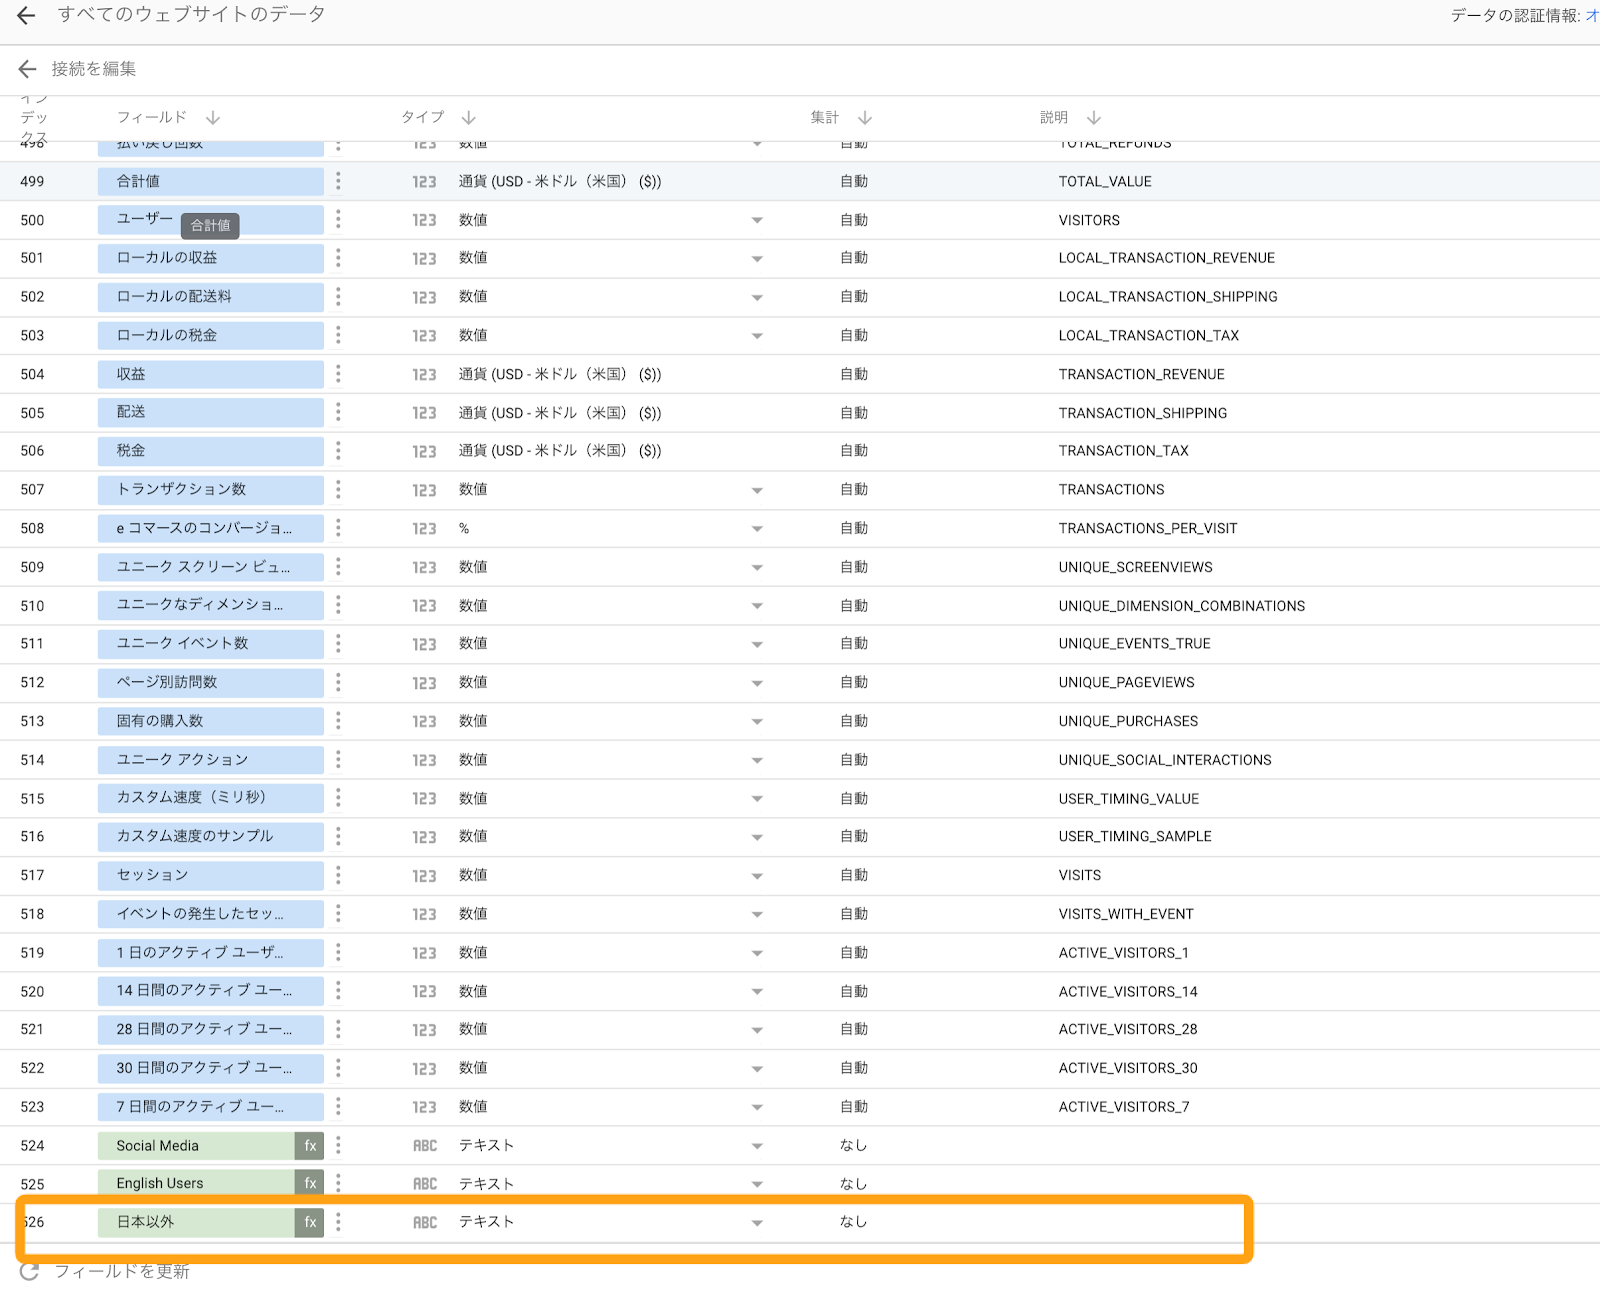
Enter a specific formula. In “Item Name”, you can put any words that you can understand easily.
If there is no problem with the formula, the following mark will appear at the lower left of the formula.
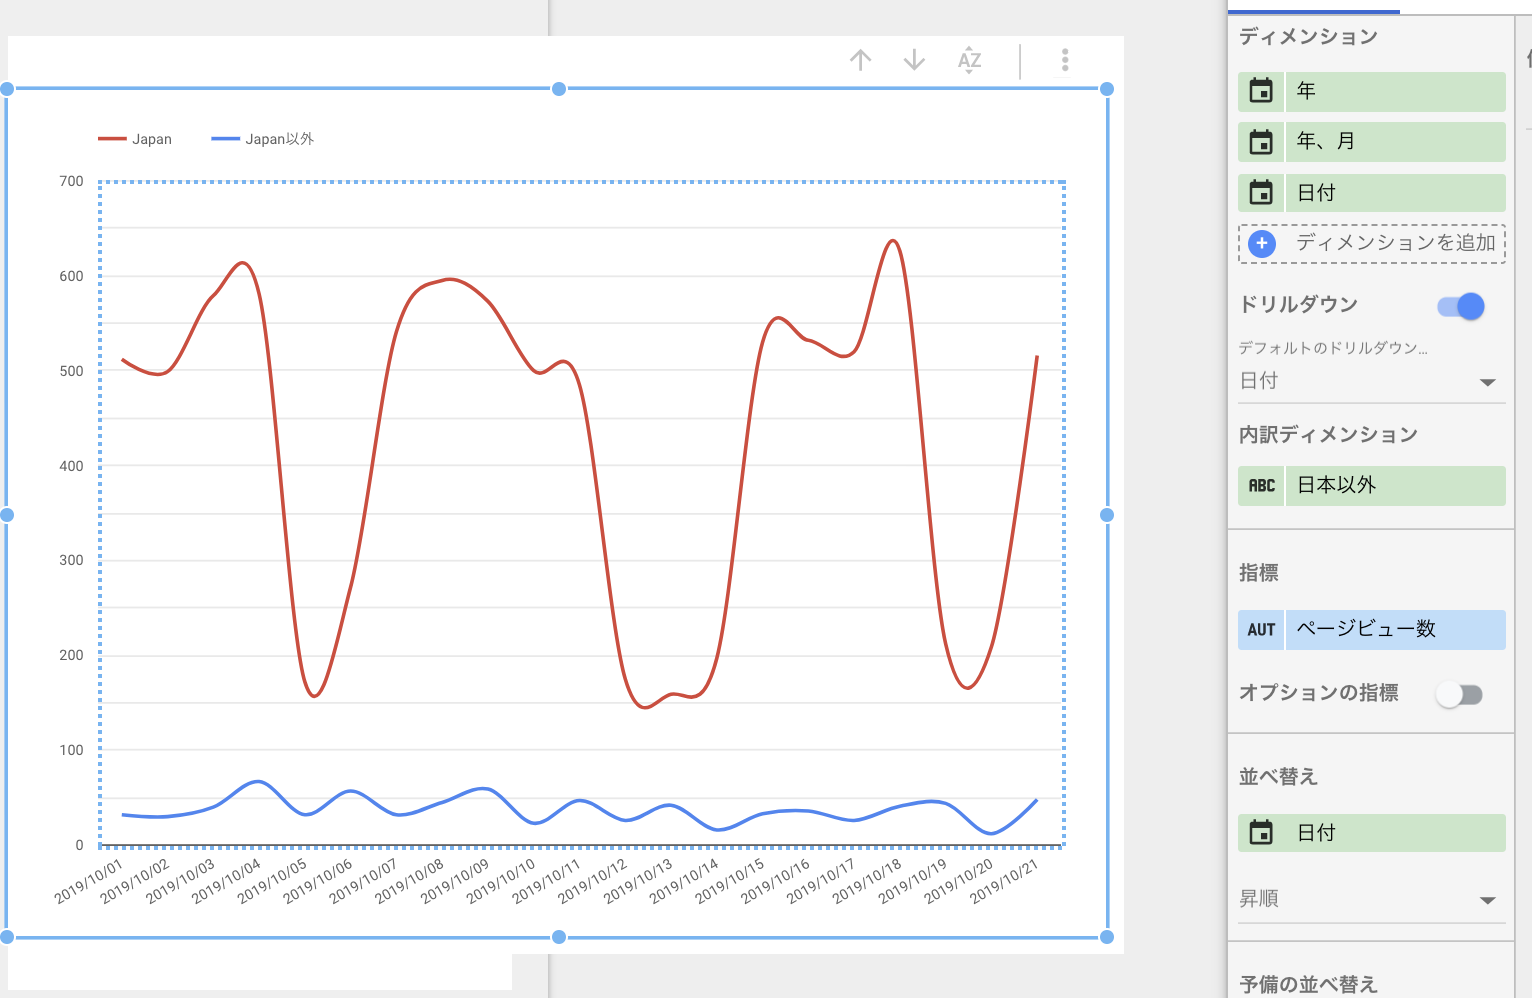
Set up the data source you just edited in Data Portal. For example, if you want to see page views in Japan and other countries on a daily basis, I set it as follows.
- Dimension: Date
- Breakdown Dimension: Outside Japan * Field created earlier
- metrics: page views
REGEXP _ MATCH function
We also introduce the REGEXP _ MATCH function. REGEXP _ MATCH returns true if the input field matches a regular expression.
Detail is here
For example, suppose you want to group English users in Google Analytics. English users are probably represented differently in different countries, such as en-us and en-gb. Let’s group “en -” as regular expressions. Data containing “en” in the language is defined as English, and all other data is defined as “Non-English.”. If you can extract the string en, you can say English.
The calculated fields are as follows:.
WHEN REGEXP_MATCH(言語,”(.*en.*)”) THEN “English”
ELSE “Non- English”
END
When we did the visualization in the data portal, we could see that it is displayed in English and Non-English as shown below.
The following are case sensitive:.
If it is not case sensitive, add (? i) and use the following expression:.
And finally,
In this article, you can see that Google Data Portal allows you to categorize any data into any group using CASE statements.
That’s it.